
Multifamily properties have outperformed other commercial property types in the past two years, benefiting directly from the continuing travails of the for-sale housing market.
Occupancies and rents have improved consistently, in seeming defiance of slow economic growth and the lethargic pace of job creation. Signs of weakness have begun to appear, however, for certain segments of the apartment market, suggesting that even the best performing property type in real estate nowadays is still subject to fundamental economic rules.
Unlike the office and retail sectors, which sport vacancies unseen in two decades, the apartment sector has bounced back impressively. After hitting a 30-year high of 8.0 percent at the end of 2009, national vacancies have plummeted to 5.6 percent by the third quarter of 2011, and are expected to dip below 5 percent by early 2012. Asking and effective rents have both posted gains on a consistent quarterly basis since the start of 2010.
Multifamily properties will continue to benefit from a convergence of positive factors: first, as the for-sale housing market continues to struggle, fewer households will make the transition from renting to owning a home. Despite record-low mortgage rates, credit still remains tight except for those with the best credit histories and capacity for large down payments. Although the rate of job creation remains moribund, the economy has created over 2 million jobs since 2010, and on the margin individuals are moving out of doubled-up households to rent their own places.
Short of expectations
While occupancies have improved significantly, national effective rents have yet to grow at the rates once projected. The rosiest predictions for national effective rent growth in 2011 exceeded 6 percent; Reis was projecting a 4.2 percent increase earlier this year, only to scale back our expectations to about 2.6 percent as of our third quarter forecasts, because actual growth has been a relatively modest 1.8 percent year-to-date.
There are some submarkets with effective rents that have risen by over 6 percent over the last three quarters, while others have fallen by close to 2 percent. Some REITs like Equity Residential report strong income growth and expect continued strength in the near-term, while AIMCO reported solid third quarter results, noting that leasing traffic decelerated in October.
Why is the rising tide for apartments not lifting all boats equally?
The root cause of this divergence in performance lies in how class-A versus class-B/C properties performed in the downturn, and how they’ve recovered since then. Apartments with higher rents took a big hit in 2009, while more moderately priced properties survived with less of a cut (and even a slight increase) in prevailing rental rates.
Manhattan apartments, which sported effective rent levels that averaged $3,613 per month in 2008, endured a 6.56 percent average decline in 2009, the largest recorded dip in Reis’s 30-year history. By contrast, apartments in the borough of Queens, across the East River, with average 2008 effective rents of $1,318, managed to eke out a 1.2 percent gain.
On average, effective rents for class-A properties across the nation fell by more than twice the magnitude of decline experienced by class-B/C properties.
Two paths to recovery
However, as the economy began posting more consistent signs of recovery in 2010, rent growth for class-A buildings roared back strongly, particularly since rents fell so much in 2009.
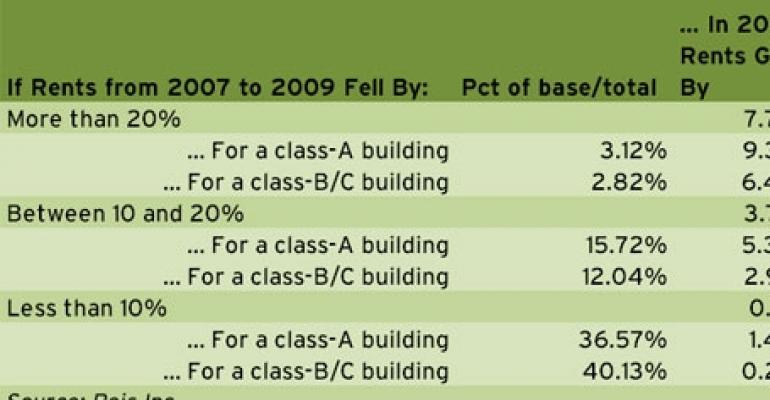
The table below shows that even if we considered specific segments of property types that endured rent declines of roughly the same magnitude, data shows that class-A rents bounced back faster than class-B/C rents. Also, the “Percent of Base/Total” column shows how a larger proportion of class-A properties endured declines of over 20 percent and between 10 to 20 percent versus class-B/C properties.

There are at least two important factors driving these results. First, since the relative premium tenants have to pay to rent a class-A apartment fell in 2009, anecdotal evidence points to households trading up the quality scale, particularly as the labor market stabilized and the U.S. economy stopped hemorrhaging jobs.
Second, and perhaps more importantly, because a majority of class-A buildings endured severe rent and occupancy declines in 2009, their impressive trajectories in 2010 and 2011 still means they haven’t bounced back to previous 2008 peaks. Many class-B/C buildings, however, which posted decent gains over the last two years, have now exceeded their 2008 highs, and are likely running smack against income constraints for tenants whose compensation levels haven’t been increasing significantly. For AIMCO’s case, for example, an analyst report explained that slowing leasing traffic is probably “due to its higher mix of lower-income tenants… as rent pressures are building most acutely on households with stagnant incomes.” Equity Residential, with a portfolio mix consisting mostly of class-A properties, is less subject to such a constraint.
Consider the example of the four metros in the table below, which calculates how much rents have grown in 2011 depending on whether a building is class-A or -B/C, and whether the ratio of the building’s average monthly rent to the metro’s average monthly household median income is in excess of 15 percent or 30 percent.

For the case of San Francisco, for example, class-A buildings that charge monthly rents that exceed 30 percent of the rent-income ratio still posted year-to-date average growth of 10.26 percent. By contrast, class-B/C buildings with rent-income ratios exceeding 15 percent could only grow by about half that amount at 5.82 percent. The data suggest that class-B/C buildings bump up against the income constraint sooner than class-A buildings.
The “current rent as percent of max” column shows how far rents have to climb before reaching previous highs from 2007 or 2008. In general, class-A buildings have more breathing space to raise rents versus class-B/C properties, which are already at between 94 to 97 percent of previous highs in this sample of cities.
The gap between class-A and class-B/C figures is closer for Buffalo and Pittsburgh, suggesting that class-A rents in places like Boston and San Francisco fell by a larger amount during the downturn, and now have space to grow before hitting the income constraint.
Not necessarily negative
AIMCO’s stock price dropped in late October because of news of slowing traffic, but it’s not as if the company entered another contractionary phase characterized by rising vacancies and falling rents.
By and large, though it may not satisfy the most bullish of Wall Street analysts, both class-A and class-B/C apartments have been posting positive returns and will continue to do so over the next 12 to 18 months.
Once national vacancies plunge below 5 percent, effective rent growth may accelerate even more. Class-A rents are likely to grow at a faster pace, driven by higher quality offerings as they make up for ground lost from the 2009 declines, but class-B/C rents will probably post increases at least equal to inflation, which is more than one can expect from other asset classes given recent spates of volatility.
What is clear, however, is that basic economic principles are still operative: For buildings of all classes in the apartment sector to sustain their performance over the long-term, economic growth, job creation and income growth must improve from its current tepid rate.
Victor Calanog is head of research and economics for New York-based research firm Reis.