
Atlanta-based Blue Vault Partners LLC, a research firm founded last year to analyze nontraded REITs, has published its first quarter 2010 Nontraded REIT Industry Review, which finds that nontraded REITs are on track to raise $7 billion in 2010, a 17 percent increase over what the sector raised in 2009.
Overall, the 49 nontraded REITs the firm analyzes have total assets worth $64.5 billion and such entities have $3.6 billion in cash and equivalents on hand. Of those, 33 are considered effective nontraded REITs—meaning they are still actively raising funds from investors. The other 16 are closed nontraded REITs and have stopped raising capital.

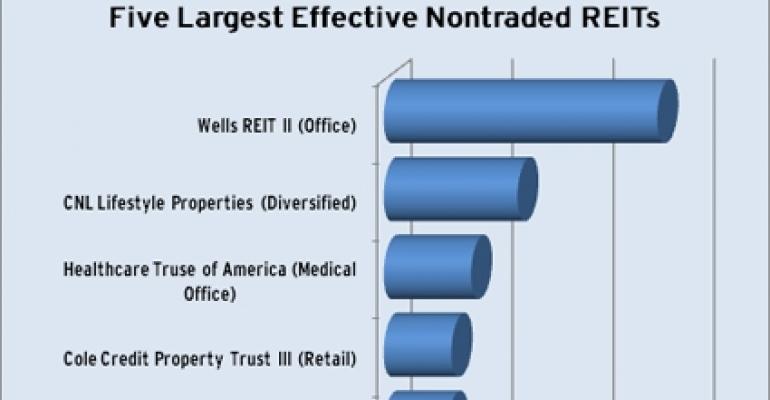
More than half of the REITs—25 in all—are diversified. The other 24 specialize in specific property sectors. Overall, there are four nontraded retail REITs. As of March 31, 2010, the firms controlled the following: Inland Western Retail Real Estate Trust Inc. had 298 properties containing 44.4 million square feet and $6.9 billion in total assets. Cole Credit Property Trust II Inc., had 693 properties containing 19.5 million square feet and total assets worth $3.4 billion. Cole Credit Property Trust III Inc. had 190 properties containing 6.2 million square feet and total assets worth $1.3 billion. TNP Strategic Retail Trust Inc. had one property containing 94,574 square feet and $18.4 million in total assets.
As a group, nontraded REITs are not heavily leveraged. The median debt to real estate assets ratio for effective REITs is 30 percent while for closed REITs it is 59.5 percent. Effective nontraded REITs had a median interest coverage ratio of 3.0 while closed nontraded REITs had a median interest coverage ratio of 2.1.

Effective nontraded REITs had a median distribution yield of 6.5 percent in the first quarter while closed nontraded REITs had a median distribution yield of 6.1 percent.
One red flag for the sector is the fact that on average nontraded REITs are not able to cover distributions through funds from operation alone. For effective nontraded REITs the distribution/FFO coverage ratio in the first quarter was 143 percent—meaning that distributions were greater than REIT income and firms had to use money from other sources outside of income to pay distributions. For closed nontraded REITs that distribution/FFO coverage ratio was 127 percent. In fact, just two effective nontraded REITs had distribution/FFO ratios under 100 percent. And just four had distribution/modified FFO ratios under 100 percent.