

The market for real estate investment trusts (REITs) has been choppy this year. Let me be more specific: The market for equity REITs has been choppy. Mortgage REITs – at least those inside the portfolios of two exchange-traded funds – have been on a quiet tear. It’s uncertain if that will continue.
Equity REITS hold claims on property; mortgage REITs hold paper. A mortgage REIT, in most instances, is an arbitrage in which issuers borrow money at the short end of the yield curve and lend or invest at the long end. Much like a bank, a mortgage REIT fares well when its funds can be obtained cheaply and lent dearly. For mortgage REIT issuers, the steeper the yield curve, the better.
There’s been some steepening, though it’s been rather ragged trend. At the start of the current fiscal year in October, the 2-10 year Treasury curve’s positive slope was 83 basis points (0.83 percent). Now, in mid-July, the yield spread is 98 bips. That 15-point hike translated into an 18.7 percent total return for holders of the VanEck Mortgage REIT Income ETF (NYSE Arca: MORT), a market cap- weighted index of about two dozen mortgage trusts.
VanEck Mortgage REIT ETF (Total Return, Closing Basis)
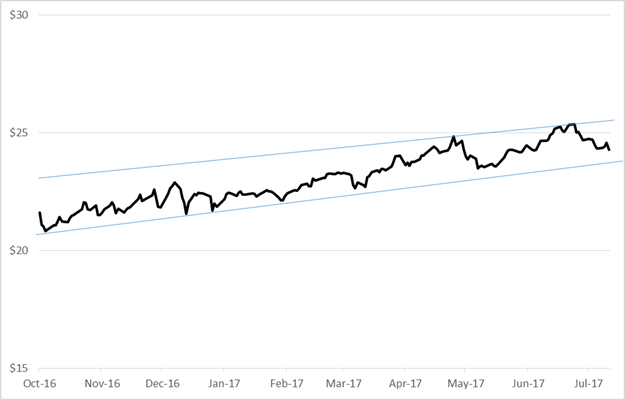
Embedded in that 18.7 percent gain has been a substantial cash yield. MORT holders have enjoyed a 6.96 percent annual payout from the ETFs’ underlying trusts.
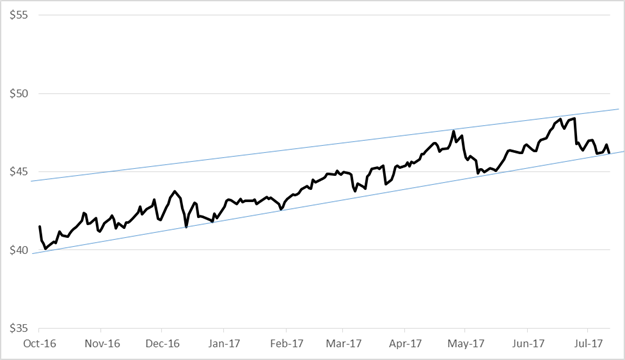
Another exchange-traded portfolio of mortgage trusts has offered income-oriented investors a comparable combination of capital appreciation and cash throw-offs. The iShares Mortgage REIT Capped ETF (NYSE Arca: REM) gained 11.3 percent this fiscal year while spitting out an 8.7 percent annual dividend yield.
iShares Mortgage REIT Capped ETF (Total Return, Closing Basis, Adjusted for 1-for-4 Reverse Split)
Going forward, things may get dicey for these ETFs. A lot of volatility has been introduced since May, wrenching prices to test the resistance and support levels of their upchannels. The challenge now, as always, is the shape of yield curve. Early in May, as the 2-10 year T-note spread widened to 106 basis points, both ETFs pushed upward to test overhead resistance, only to be followed by a carom shot to support below. The cycle repeated in June and July. Now investors see the ETFs near their support levels again.
So, is there enough downward momentum to pierce support and send prices lower? Or can the ETFs recover to stay within their upchannels a while longer?
The answer depends on your confidence in the shape of the yield curve. Inflation expectations drive the long end and those expectations have been softening. The Fed’s influence is felt more at the short end. Janet Yellen’s recent testimony before Congress was essentially a Goldilocks moment: She offered balm for virtually everyone. No help there.
Best advice? Hold your ETFs but keep a moving stop about 4 percent below the current support level.
Brad Zigler is WealthManagement's Alternative Investments Editor. Previously, he was the head of Marketing, Research and Education for the Pacific Exchange's (now NYSE Arca) option market and the iShares complex of exchange traded funds.