
Corrected at 6:46 PM
Update 1 on Dec. 22, 9:18 AM
Update 2 on Dec. 22, 2:43 PM

Indexes designed to gauge commercial real estate values have been around for a few years now. The original intention was that creators of various indexes were competing to create the benchmarks around which commercial real estate derivatives could be created. Pros had a vision that it would give investors an alternative to buying and selling actual real estate and REIT stocks in playing in the commercial real estate space.
The 2008 financial collapse and the subsequent leeriness about derivatives pretty much killed that idea (at least for now), but the desire to design the best commercial real estate index remained. The original players in the market were Standard & Poors, the Chicago Mercantile Exchange and Global Real Analytics; Real Capital Analytics and the Massachusetts Institute of Technology Center for Real Estate; and the Rexx Real Estate Property Index, which includes backing from Cushman & Wakefield and Newmark Knight Frank.
But the landscape has changed. Today, the first and third ventures are is now defunct. Correction: The Rexx index still exists. It has been renamed the REBOR Index.
Moody's now works with MIT and Real Capital and that index has become a popular reference point. In addition, Green Street Advisors and CoStar have entered the fray and begun producing their own indexes.
The question: Which one of these is the best? Moody's, as the most established, continues to get the most exposure. But the other indexes are getting mentioned more often and both CoStar and Green Street claim there are key differences in how they're measuring prices compared with the Moody's/RCA index. Bloomberg's monthly report on prices now often cites all three.
What's often lacking, however, is a look at how the three compare.
According to Green Street, "Green Street Advisors' Commercial Property Price Index (GSA CPPI) is a real-time series of unleveraged U.S. commercial property values. The key feature differentiating this index from others is its timeliness. The GSA CPPI captures the prices at which commercial real estate transactions are currently being negotiated and put under contract." Meanwhile, CoStar says its numbers are different from Moody's because "Moody's pricing index uses the data that DOES NOT include sales under $2.5M. CoStar Group's monthly index is the only repeat sales index that covers sales transactions from $100,000 and above. And Moody's chooses deals by a sale price while CoStar uses property class, size etc. so the two indexes won't have the exact same deals in the datasets."
Update 1: Chris Macke, senior real estate strategist for CoStar got in contact with us and provided some more information on what distinguishes the indexes.
He wrote:
The primary difference between our index and Moody's index is the source of data. We use our own sales transaction data while Moody's uses sales data from a third party. This not only means our underlying sales database is different but because we use our own data we report monthly results on average 2-3 weeks before Moody's. Moody's just reported their results for October transactions while we reported October commercial real estate pricing activity about two weeks ago on CNBC.Regarding the Green Street index, it is not a pricing index. It does not measure prices of commercial real estate. It is Green Street's estimate of value.
...
All three indices have their place and value. What is critical is that the market understands the material differences between them.
Update 2: David Geltner, professor of real estate fnance at the MIT Department of Urban Studies & Planning and author of the Professor's Corner commentaries on the Moody's/REAL index, also contacted me with some further comments.
Here is what he wrote:
The commercial real estate market in the U.S. these days is a rather complicated animal, or rather, animals (plural). We have been using the RCA repeat-sales database that underlies the Moody's/REAL CPPI to track pricing in three separate market segments that have opened up and grown apart during 2010: "Trophy" properties, "Distressed" properties, and, well, everything else ("Other"). Trophies are up big-time, Distressed has been very volatile but has recently also turned up although from a much lower price point, and the broad "Other" segment (everything neither Trophy nor Distressed) has been languishing. And these three segments are just within the "institutional" market (the properties valued $2.5M+ that RCA tracks), not even including the smaller "mom & pop" properties that CoStar tracks.I would also add (which you can see graphically in the commentary) that the main reason why the two price indices (Moody's/REAL & CoStar) have not bounced up further this year is the role of distressed property sales in the overall market as tracked by those indices. Both Moody's/REAL and CoStar are equal-weighted indices tracking broad markets. Trophy properties, while large on average, represent a small share of the number of transactions. On the other hand as far as I understand the Green Street index is not exactly a price index, and it is aimed at just REIT-held properties, and I believe it is value-weighted rather than equal-weighted, all of which would explain why/how it presents the larger apparent bounce (as well as the leading nature that Green Street is trying to reflect by focusing on deals in negotiation).
(Editor's note: Thanks to both Chris and David for writing in with those clarifications.)
If you want to pore more deeply into the differences you can download the methodologies for CoStar, Moody's/RCA and Green Street Advisors.
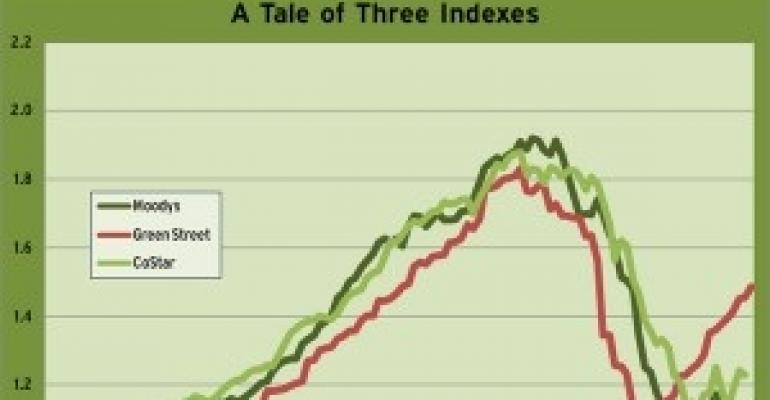
I've gone ahead and attempted to chart the three indexes against each other. CoStar and Moody's both use December 2000 as the baseline for their indexes. (For CoStar, the data is its investment grade index.) Green Street Advisors, however, uses August 2007 as its base. I attempted to reindex it by creating a new index where December 2000 = 100 and then had it match the month-by-month percentage changes of the original index. The result is the chart above.
What does it tell us?
Most broadly, the indexes appear pretty similar on the way up and the way down, but have begun to show some more interesting divergences of late. In general, Moody's and CoStar's indexes show similar magnitudes of price appreciation during the industry's good years. Green Street's peak is a tad lower. The peaks on all three indexes come in 2007, but Green Street and CoStar measure the peak several months earlier than Moody's does.
In the decline phase, Green Street's index fell earlier and bottomed earlier. Its bottom is also not as for the CoStar or Moody's indexes. Green Street's index hit bottom all the way back in May 2009. In contrast, CoStar's bottomed in February 2010 and Moody's in August 2010. The difference stems from Green Street's attempt to capture the prices at which commercial real estate transactions are currently being negotiated and put under contract rather than closed.
More remarkably, Green Street's index shows commercial real estate prices rebounding much more dramatically than the other two indexes. According to Green Street, commercial real estate values have gained a lot of ground. CoStar and Moody's indexes are off their bottoms, but seem to be bouncing along a trough.
So which index do you think is right?
Highlights:
- The Moody's index peaked at 1.919 in October 2007; CoStar's peaked at 1.879 in August 2007; and Green Street's peaked at 1.831 also in August 2007.
- The low point in the Moody's index came in August 2010 with a reading of 1.054. Peak-to-trough, Moody's index fell 45.1 percent. The low point in the CoStar index came in February 2010 with a reading of 1.121 Peak-to-trough, CoStar's index fell 40.3 percent. The low point in the Green Street index, in contrast, came much earlier with a reading of 1.129 in May 2009. Peak-to-trough, Green Street's index fell 38.3 percent.
- Currently, Moody's index is still 41.9 percent below its peak. CoStar is 34.5 percent below its peak and Green Street's is 20.5 percent below its peak.
- Moody's index is 5.7 percent above its low point. CoStar's index is 9.7 percent above its low point. Green Street's, meanwhile, is 28.8 percent above its low point.