

Many who toil in real estate analysis like to use as many statistics as possible to evaluate how a property market is faring. In addition to the usual vacancy rate and rent trend analyses, other demand variables are sought to determine what is driving the market. The preferred metric for demand is employment, and for office demand, labor statistics are often whittled down to determine an “office using employment” measure. In theory, office employment growth should serve as a variable that correlates highly with office occupancy and rent trends, but as the economy has evolved and industrial classification systems have shifted the estimate for office employment may not capture all of those truly working in an office setting.
Still, one can’t help but consider this statistic as a reliable indicator of office demand.
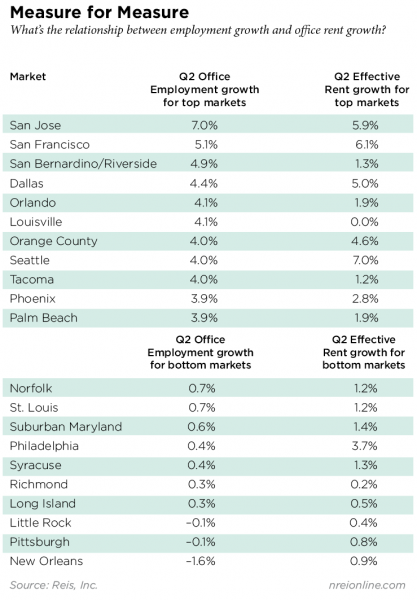
A close look at the data across 80 markets in the U.S. shows that office employment is indeed highly correlated with office rents and occupancy growth. Markets with the highest office employment as of the second quarter of 2015 include San Jose, San Francisco, Dallas and Seattle. These four also had the strongest rent growth rates. At the other end of the scale, only three markets saw slight year-over-year declines in office employment in the second quarter: Little Rock, Ark., Pittsburgh and New Orleans. Rent growth was still positive in these markets, but very low. Occupancy growth was negligible.
This market-by-market comparison is a worthy analysis not only to confirm why some markets are growing faster than others, but also to notice the outliers or those markets where office employment is outpacing rent and occupancy growth by a considerable margin and vice versa. Indeed, quite a few markets do show employment growth rates well above rent growth rates. Could this be because of higher relative vacancy rates and/or expected new construction? Some of the outlier markets where office employment growth has been significantly higher than effective rent growth include Palm Beach, Fla., Fort Lauderdale, Fla., San Antonio, Texas, San Bernardino/Riverside, Calif., Orlando, Fla. and Louisville, Ky., where office employment growth rates (year-over-year) have averaged between 3.0 percent and 5.0 percent over the last three quarters. Effective rent growth for each of these markets was at or below 2.0 percent for the same time periods.
What is driving this divergence in growth rates? A quick look at the occupancy statistics shows, not surprisingly, that markets with higher employment growth had higher occupancy growth, while those with low employment growth had flat occupancy growth. However, the outlier metros mentioned above had lower net absorption numbers, and similarly, higher overall vacancy rates. This suggests that the occupancy in some of these markets is less dense, meaning that employers were able to fill offices without taking on more space, creating less pressure on rent growth. Other than Louisville, the vacancy rates for the outlying markets mentioned above range from 16.8 percent to 23.9 percent, above the national rate of 16.6 percent.
On a separate note, a review of the markets where job growth was lowest showed that only a few markets have exhibited minor losses in office employment over the last few quarters, and not one of the 80 markets reviewed had losses for three quarters in a row.
Correlation between Office Employment and Rent Growth is Strong
It should be noted that office employment growth had a consistently higher correlation with effective rent growth than with occupancy growth. Moreover, the correlation between office employment growth and rent growth is higher than the correlation between office occupancy growth and rent growth.
The takeaway from this exercise is that office employment does serve as a highly reliable market indicator, but more so when vacancy rates are lower than the national average. So could this variable serve as a lead indicator? The answer is a qualified maybe. The correlation between office employment growth in 2014 and rent growth in the first quarters in 2015 were only slightly higher than the concurrent correlation coefficients, not sufficient to draw any conclusions. Still the analysis clearly demonstrates the importance of having this third indicator for analyzing market conditions and for monitoring office employment trends over time to get a better, more rounded sense of the local market than vacancy rates and rent trends alone can provide.
Barbara Byrne Denham and Victor Calanog are economists at Reis, Inc, a provider of commercial real estate data and analytics.